The IPCC’s 1.5°C Report is a Strategic Lie
By Frank Rotering | February 19, 2017
Picture a doctor and his patient. She has a severe infection, which is causing an intense fever. The doctor is concerned that a further rise in body temperature will lead to organ failure, so he applies ice packs and a cooling blanket. However, he fails to treat the infection, so the patient’s temperature continues to rise. The doctor’s concern now escalates, so he goes high-tech. He inserts an endovascular device into a blood vessel to cool the patient’s blood directly, but he still refuses to treat the infection. As a result the patient’s temperature rises to a fatal level, and she dies.
This kind of medical incompetence is hard to imagine, but it is an accurate analogy for the IPCC’s climate strategy, which was once again on display in its recent report, Global Warming of 1.5°C. In the analogy’s terms, the IPCC is attempting to treat the global warming fever while ignoring the infection of unsafe GHG concentrations. This extraordinary blunder is far more significant than the reduction of the temperature threshold from 2°C to 1.5°C. In recent posts I have addressed the organization’s errors, deceptions, and Newspeak-like terminology. The recent report is a good opportunity to highlight the strategic lie that underpins the entire mess.
A bit of history is required for context. The IPCC-led process to combat the GHG crisis was initially based on the avoidance of unsafe GHG concentrations (see Article 2 of the 1992 UNFCCC convention). This made sense because excess concentrations are the cause of global warming and the resultant climate change. It was therefore understood in the early 1990s that, although the Earth’s surface temperature must be carefully monitored in case cooling blankets are urgently required, the underlying problem must be treated by controlling the infection of GHG concentrations.
In the years since then, however, this understanding has been mysteriously lost. The IPCC now focuses almost entirely on the rising global temperature caused by GHG emissions. It has therefore shifted its attention from the problem itself, which is the concentrations-based warmth, to the problem’s marginal increments – the emissions-based warming. The role of this bizarre regression in the IPCC’s false strategy can be clarified with the graph below.
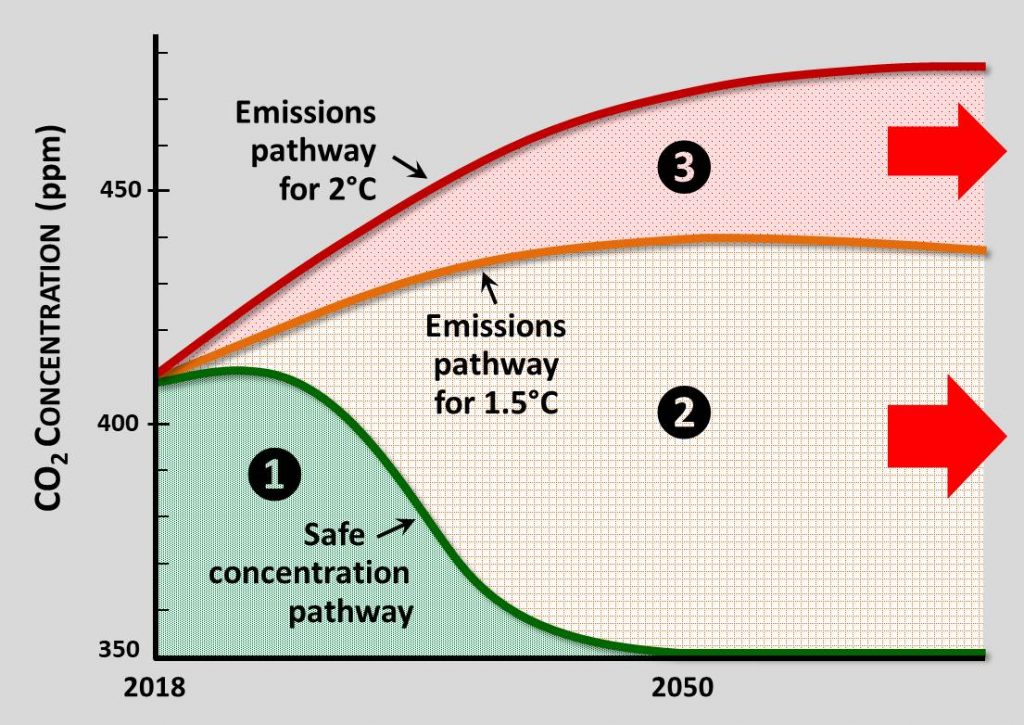
Here the CO2 concentration is used as a proxy for the GHG concentration as a whole. The graph therefore depicts the change in the atmosphere’s CO2 concentration over time, for three different pathways or trajectories. I will first examine the 1.5°C and 2°C emissions pathways that are addressed in the report and then discuss the safe concentration pathway that is their rational alternative.
As shown, the atmospheric CO2 concentration is now approximately 410 ppm. The IPCC’s proposed strategy is represented by the middle curve: the emissions pathway for 1.5°C. Using the report’s conservative figure, the concentration initially rises at 2 ppm per year. This drops to 0 ppm around 2050 as “net-zero” (emissions minus removals) is achieved. The result is that CO2 reaches its maximum level at about 440 ppm. The report proposes CO2 removals around this time, so the rest of the curve moves slowly downward.
One thing that is immediately evident from this curve is that reducing emissions to zero achieves nothing more than halting the rise in the concentration level. At “net-zero” the CO2 level stabilizes, but it is higher than ever before, and it won’t decrease until net CO2 removals begin. Although the dizzying reductions in CO2 emissions depicted in this diagram (Summary for Policymakers, p. 6) have shocked some commentators, they simply represent the flattening of the concentration curve.
The critical issue, however, is the environmental damage caused by each pathway. In previous posts I have stated that such damage is a function of the speed, magnitude, and duration of the elevated temperature. It was therefore a pleasant surprise to see that the report says virtually the same thing. The Summary for Policymakers states on page 8 that, “Future climate-related risks depend on the rate, peak and duration of warming.”
Because warming is directly tied to GHG concentrations, this means that the damage to Earth systems is proportional to the area under the curve for each of the three pathways, plus the effects of the warming rate. The latter is unprecedented and thus difficult to quantify, so let’s put it aside. The damage associated with the 1.5°C pathway is then represented by the sum of areas 1 and 2. Area 2, however, continues to expand until the curve reaches the horizontal axis in the distant future, so the total damage it represents is massive. Given the proximity of tipping points and points of no return, there is no question that the 1.5°C pathway ends in ecological collapse.
The 2°C emissions pathway is of course even worse: it sends concentrations higher and generates damage that extends further into the future. Remarkably, this difference between the two pathways is the report’s only significant message. There is no attempt to justify the 1.5°C pathway itself because it can’t be rationally justified. Instead the now-standard tactic of “avoiding the worst consequences” is applied. This grants solution status to any course of action that is superior to a more disastrous alternative. The fact that such “better” solutions are also ecocidal is swept under the rug.
Let me now turn to the safe concentration pathway. This embraces the original UNFCCC objective by lowering the CO2 concentration so as to minimize its harmful impacts on Earth systems. On the optimistic assumption that 350 ppm is safe, the curve declines from 410 ppm to 350 ppm by 2050. The resulting environmental damage, represented by area 1, is extensive and may still trigger tipping points and points of no return, but it provides our species with at least a chance for survival.
Besides this incalculable benefit there are at least two other advantages to the safe concentration pathway: analytical simplicity and certainty. The 1.5°C and 2°C pathways require sophisticated computer models, involving numerous assumptions and simplifications, to estimate the temperature results of various emissions pathways. As the report candidly admits, these estimates are fraught with huge uncertainties. For example: “… the 1.5°C-consistent pathways allow a substantial (up to one-in-two) chance of warming still exceeding 1.5°C.” (Chap. 1, p. 18) This is only one of many statements in this vein. The word “uncertainty” and its variants in fact appear an astonishing 334 times in the report. Thus, even if the 1.5°C strategy were valid, its implementation would be like shooting at a fuzzy target with unsteady hands.
Compare this with the safe concentration pathway: virtually no analysis is required, and certainty is 100%. The task is to reduce the CO2 concentration – that is all. It would be helpful to know the safe level, but even this is not required – so long as the concentration is dropping we know we’re on the right track. The only analysis that’s really necessary is to determine if 2050 is the right “safety date”. Perhaps extreme danger lurks unless this is advanced to 2040. Conversely, a rapid drop in the CO2 level might give us the luxury of postponing the date until 2060.
To sum up using the medical analogy: The IPCC, in its 1.5°C report, is encouraging the world to overlook numerous complexities and uncertainties, choose a perilous fever level over one that is even more perilous, and ignore the infection that was identified 26 years ago as the fever’s cause. One might reasonably conclude that, if the IPCC were a doctor, it would be stripped of its medical license. Instead the organization shared the Nobel Peace prize in 2007 and is daily lauded as the world’s foremost authority on climate change.
Minor edits: Dec. 18/18